
OTWONO LABS / NOTEBOOK
Reading charts: understand the values behind the picture
Learn one step at a time, with examples, practice and a place for your questions.
Start this lessonInvestigating problems · LESSON 3 OF 3
Read a bar chart’s labels and scale, then distinguish a total count from a completion percentage.
Before you start: Compare whole numbers. We show the division used for percentages.
Suggested pace: 20 to 35 minutes, with extra time for practice. You can stop after any section and return.
Start with something concrete
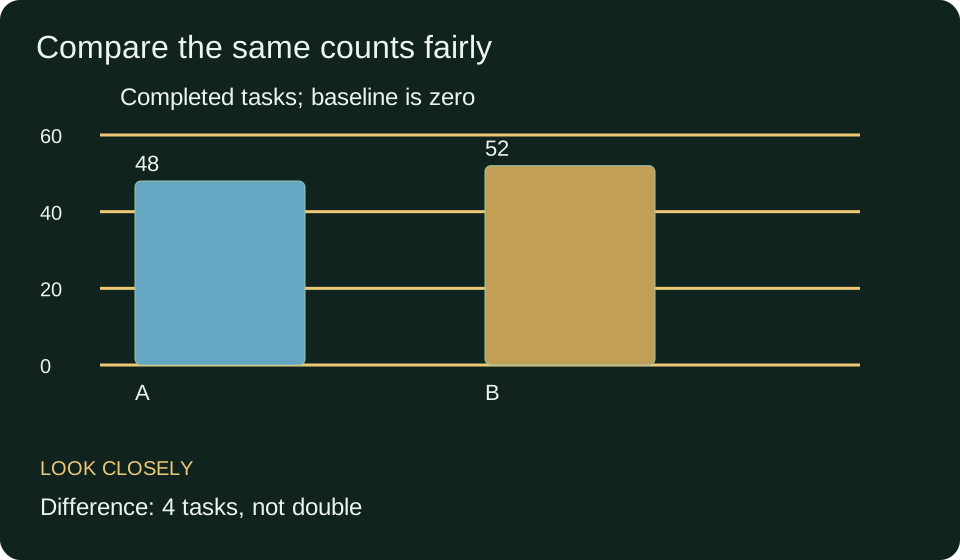
Two teams complete tasks. Team A completes forty eight and team B completes fifty two. A bar chart can show these counts, but you must read its scale before judging the difference by eye.
The words we will use
- Axis
- A reference line whose marks show the scale of a chart.
- Baseline
- The starting value from which a bar’s length is drawn.
- Count
- How many items there are.
- Percentage
- A fraction expressed out of one hundred.
Understand the idea
On a bar chart beginning at zero, a bar for fifty two is slightly longer than one for forty eight. The numerical difference is four tasks. It is not twice as many tasks.
If a chart begins at forty seven, the visible bar lengths above that baseline would be one and five. Those visible lengths look very different, although the underlying counts are unchanged. For bar length comparisons, zero provides a direct proportional starting point.
Counts also leave out opportunity. If A was assigned sixty tasks and B eighty, the completion fractions differ. A completed 48 / 60 = 0.8, or eighty percent. B completed 52 / 80 = 0.65, or sixty five percent. B has the higher count, while A has the higher percentage.
Teacher example: read the chart, then ask for the denominator
- Identify what the bars count: completed tasks.
- Read the common scale, starting at zero.
- Subtract 48 from 52 to find the four task difference.
- Ask how many tasks each team was assigned before comparing completion percentages.
Connect the example to the rule
A chart can correctly display one measure while being insufficient for your question. Ask what decision you are trying to make. Total output, completion rate and output per worker are different measures and may rank teams differently.
Your turn, with support
A completes 48 of 60 tasks and B completes 52 of 80. Which has the higher completion fraction?
Show one hint
Divide each completed count by its own assigned total.
Compare your working
A: 0.8, compared with B: 0.65. A has the higher completion fraction even though B completed more tasks.
A mistake worth understanding
A dramatic looking difference is not automatically a dramatic numerical difference. Inspect the labels, baseline and units. Do not accuse a source of intent from the visual alone; explain exactly how the display affects interpretation.
Check the idea before moving on
The interactive questions load when JavaScript is available. You can still use all written practice below.
Now solve without the example
- A completes 18 of 20 items. Find the percentage.
- B completes 27 of 30. Compare its percentage with A.
- Which team has the higher completed count?
Check the independent answers
- Ninety percent.
- Ninety percent, the same rate.
- B, with twenty seven. Equal percentages do not require equal counts.
Use it in a new situation
A headline compares two schools by the total number of students passing. What extra number do you need to compare pass rates?
Compare a possible solution
The number tested in each school. You also need comparable tests and definitions before interpreting the rates.
What to take away
Read what is counted, inspect the scale, calculate the difference and find the relevant denominator.
Before your next lesson
Close this page and explain the main idea in your own words. Rework one of the independent problems without looking. If a step is still unclear, return to the worked example and compare that exact step. Tomorrow, try the transfer problem again before opening its answer.
For a saved introductory check, open this lesson in your signed in workspace and choose Tests. Practice choices on this page are not a qualification or a substitute for independent work.
You reached the end of this introductory path. Browse another subject or revisit a lesson that needs more practice.