
OTWONO LABS / NOTEBOOK
Comparisons: measure a difference without inventing its cause
Learn one step at a time, with examples, practice and a place for your questions.
Start this lessonInvestigating problems · LESSON 2 OF 3
Calculate a simple group average and explain what additional information is needed for a fair comparison.
Before you start: Add three numbers and divide by three. The lesson introduces the meaning of an average.
Suggested pace: 20 to 35 minutes, with extra time for practice. You can stop after any section and return.
Start with something concrete
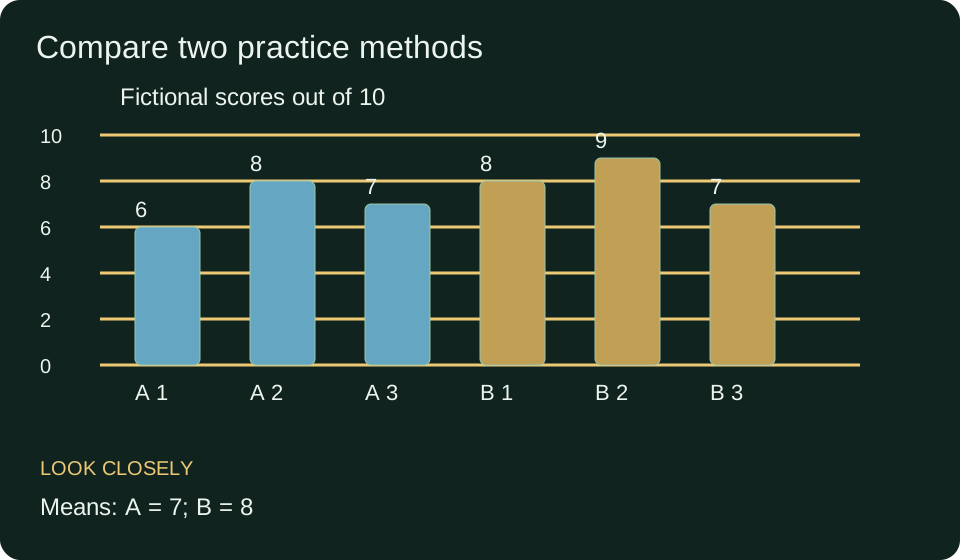
Two fictional groups try different practice methods and answer ten questions. Group A scores six, eight and seven. Group B scores eight, nine and seven. We want to describe the results before deciding what they mean.
The words we will use
- Measurement
- A recorded value obtained using a defined rule.
- Mean
- The sum of values divided by their count, one kind of average.
- Alternative explanation
- Another factor that could account for an observed difference.
Understand the idea
The mean summarizes a group in one number. For A, add 6 + 8 + 7 to get 21, then divide by three learners to get seven. For B, the sum is 24 and the mean is eight.
B has a higher sample mean by one correct answer. But individual scores overlap: both groups include a seven and an eight. An average does not say that every member of one group outperformed every member of the other.
To interpret the difference, ask whether the tasks, scoring, time and starting knowledge were comparable. If B answered easier questions, task difficulty could explain the difference. Calculating a mean correctly does not make the design a fair test.
Teacher example: inspect individual scores before summarizing
- Read the six scores in the chart, each out of ten.
- Compute A: 21 ÷ 3 = 7.
- Compute B: 24 ÷ 3 = 8.
- Report the observed difference and the limits: the mean is one point higher in B, but this small fictional comparison does not establish that the practice method caused it.
Connect the example to the rule
Before a real comparison, decide what counts as success and how it will be measured. Choose comparable tasks and document how people entered each group. Random assignment can help reduce systematic group differences, but a useful study still needs an appropriate design and enough evidence.
Your turn, with support
If group B had easier questions, would its mean still be eight? Would the cause of its higher score be established?
Show one hint
Separate the arithmetic from the interpretation.
Compare your working
The recorded scores still average eight. But the method’s effect is not isolated because easier questions are an alternative explanation.
A mistake worth understanding
Saying ‘B is better’ leaves out better at what, for whom and under which conditions. Report the measured outcome and the scope of the evidence instead of turning a limited comparison into a universal claim.
Check the idea before moving on
The interactive questions load when JavaScript is available. You can still use all written practice below.
Now solve without the example
- Find the mean of 4, 6 and 8.
- Can that mean tell you whether all three learners scored six?
- Name two conditions you would hold comparable when testing study methods.
Check the independent answers
- Six.
- No. These values average six but are different individually.
- Examples include task difficulty, allotted time and scoring rules. Starting knowledge and group assignment also matter.
Use it in a new situation
Two search layouts are tested by timing how long people take to find a file. One group has used its layout for months. What limitation must be recorded?
Compare a possible solution
Familiarity differs between groups and may affect search time. A speed difference cannot automatically be attributed to layout alone.
What to take away
Define the outcome, inspect individual values, calculate the summary and separate the observation from a causal claim.
Before your next lesson
Close this page and explain the main idea in your own words. Rework one of the independent problems without looking. If a step is still unclear, return to the worked example and compare that exact step. Tomorrow, try the transfer problem again before opening its answer.
For a saved introductory check, open this lesson in your signed in workspace and choose Tests. Practice choices on this page are not a qualification or a substitute for independent work.
Next in this path: Reading charts: understand the values behind the picture